

Cassandra Monitoring Best Practice Series 1: Diagnosing High Latency
This first post in the Cassandra Monitoring Best Practice series focuses on latency. The goal is to show which metrics need to be captured and how they can be used together to identify the exact cause of a high-latency incident.
If you are trying to monitor Cassandra properly, node-level health on its own is not enough. CPU, disk, memory, and GC are still important, but most real production incidents do not stop there. The difficult cases are the ones where the cluster is up, the nodes are not obviously saturated, and application latency is still climbing. That is where Cassandra monitoring needs to go beyond host metrics and down into coordinator behavior, threadpools, and table-level read and write paths.
This is also where many teams lose time. They can see that Cassandra is slow, but they cannot tell whether the problem is host saturation, GC pressure, a queue building in a threadpool, a consistency-specific coordinator path, or one table that has become expensive to read. Good Cassandra monitoring closes that gap.
This guide is written for engineers who want a practical monitoring workflow rather than a product tour. It uses the monitoring surface that AxonOps captures because it reflects the level of detail Cassandra teams actually need in production. If you want to see that monitoring surface directly, the AxonOps Cassandra monitoring page shows how the metrics, logs, service checks, and alert routing are presented.
Cassandra Monitoring Starts With Capturing The Right Metrics
Capturing the right metrics is where Cassandra monitoring starts. The easiest way to think about it is by layers: begin with the host and JVM, then move inward toward the Cassandra request path.
1. System and OS metrics
These tell you whether the node itself is saturated before you blame Cassandra internals.
| Metric | What it tells you |
|---|---|
| CPU utilization | Whether the node is compute-bound and running out of headroom for Cassandra work. |
| Load average | Whether runnable work is stacking up faster than the node can schedule it. |
| I/O wait | Whether latency is being driven by storage stalls rather than Cassandra logic alone. |
| Disk throughput | Whether the node is pushing enough read or write traffic to approach storage limits. |
| Filesystem usage | Whether low free space is starting to affect compaction, flush, or general stability. |
| Network throughput | Whether replication or client traffic is saturating the node’s network path. |
If you only capture one category outside Cassandra itself, make it this one. A large share of latency incidents still come from compute saturation, storage contention, or noisy neighbors in the underlying environment.
2. JVM metrics
The next layer is the Cassandra process.
| Metric | What it tells you |
|---|---|
| Heap usage | Whether Cassandra is approaching memory pressure inside the JVM. |
| Old generation pressure | Whether long-lived objects are accumulating and increasing the chance of slower GC cycles. |
| GC pause time | Whether application latency is being affected by stop-the-world or long concurrent pauses. |
| GC frequency | Whether the JVM is working too hard to reclaim memory even before pauses become extreme. |
| Thread counts | Whether the process is creating unusual concurrency pressure or leaking work. |
| Buffer and direct memory usage | Whether off-heap and JVM-managed buffers are contributing to memory stress. |
If the cluster is spending time in GC, the symptom often appears as application latency long before someone labels it a JVM issue.
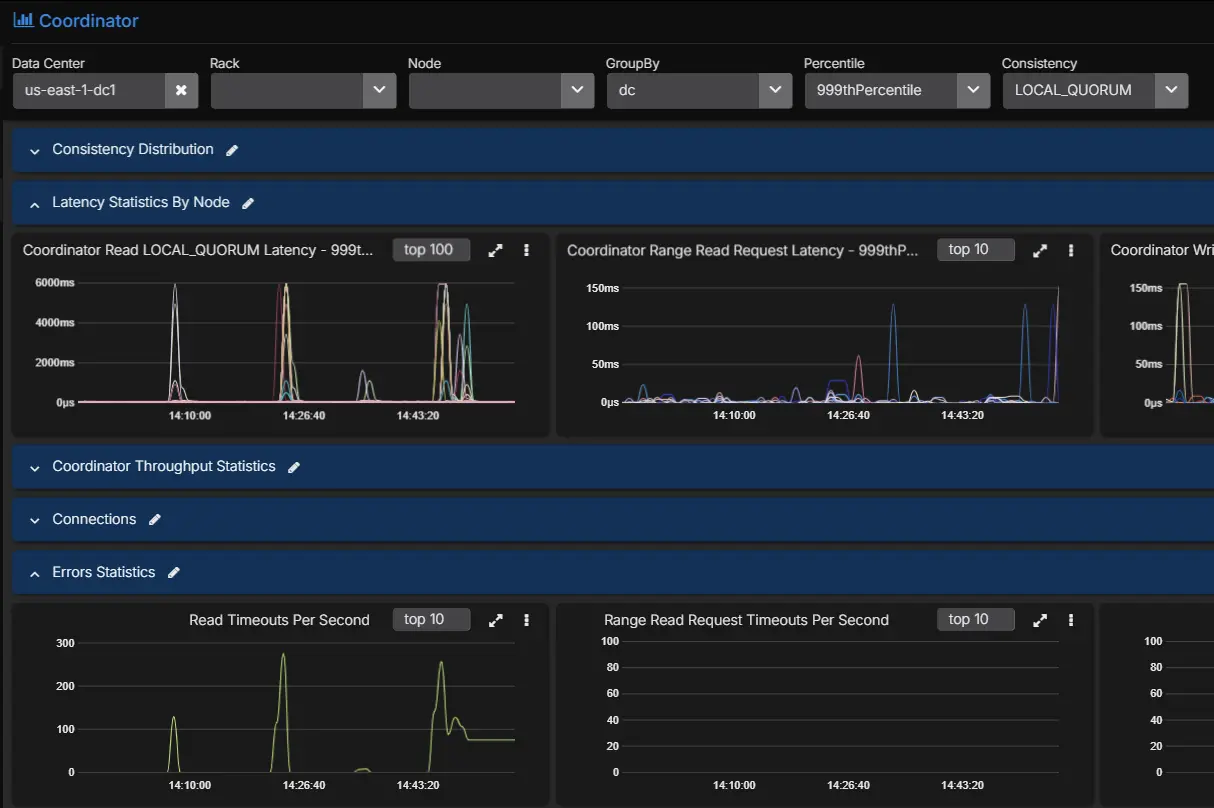
3. Coordinator metrics
Coordinator metrics tell you what the request path looks like from the node handling the client request. This is where you start to separate average behavior from tail behavior.
The useful set includes:
| Metric family | What it tells you |
|---|---|
| Coordinator read latency | How long standard reads take from the point of view of the coordinator node. |
| Coordinator range read latency | Whether range scans are slower than point reads and widening the latency tail. |
| Coordinator write latency | Whether the write path is slowing down at the coordinator before acknowledgements return. |
| Coordinator read throughput | Whether read traffic changed materially when the latency problem started. |
| Coordinator range read throughput | Whether scan-heavy activity is driving more expensive request patterns. |
| Coordinator write throughput | Whether write volume or bursts line up with the incident window. |
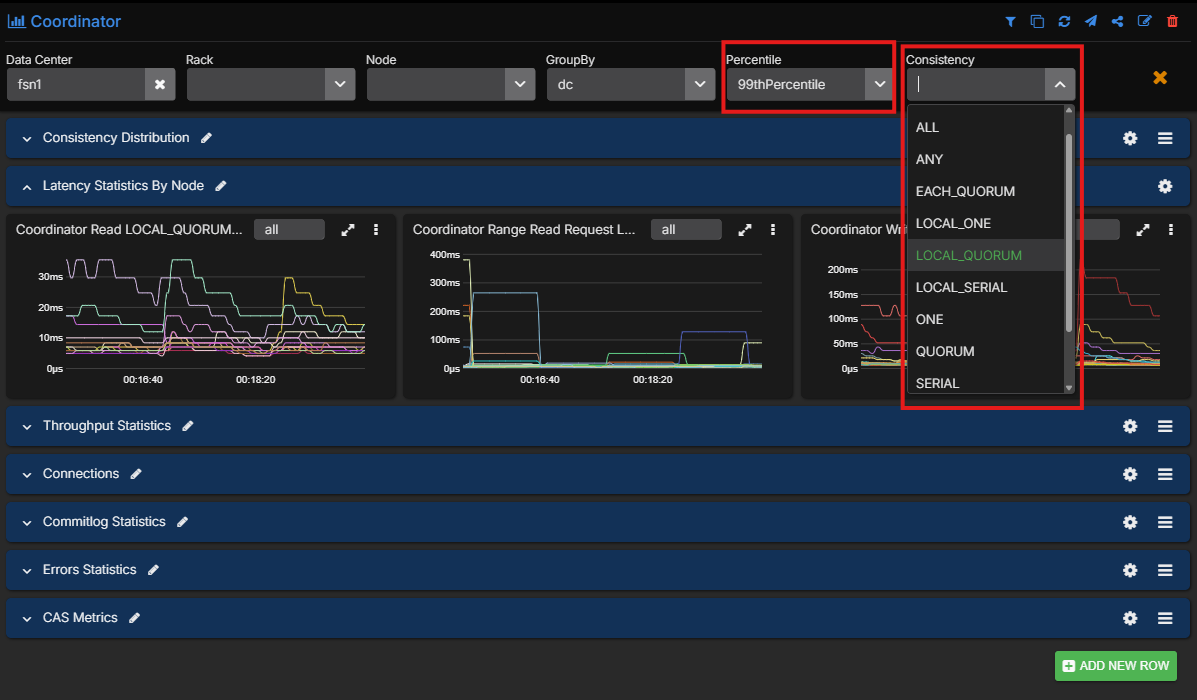
Those latency metrics are far more useful when captured at multiple percentiles rather than as a single average. Cassandra teams usually need to see at least:
| Percentile or view | What it tells you |
|---|---|
| Minimum | Useful for confirming the floor of normal performance. |
| p50 | Shows typical behavior seen by most requests. |
| p75 | Helps identify early drift before the tail becomes severe. |
| p90 | Often where read-path stress starts becoming visible. |
| p99 | Usually the first percentile that makes a user-facing latency problem obvious. |
| p999 | Shows whether the extreme tail is much worse than the rest of the workload. |
| Maximum | Useful for spotting rare pathological spikes. |
AxonOps also captures coordinator metrics across consistency levels, which is important because a LOCAL_QUORUM problem and a ONE problem are not the same operational story.
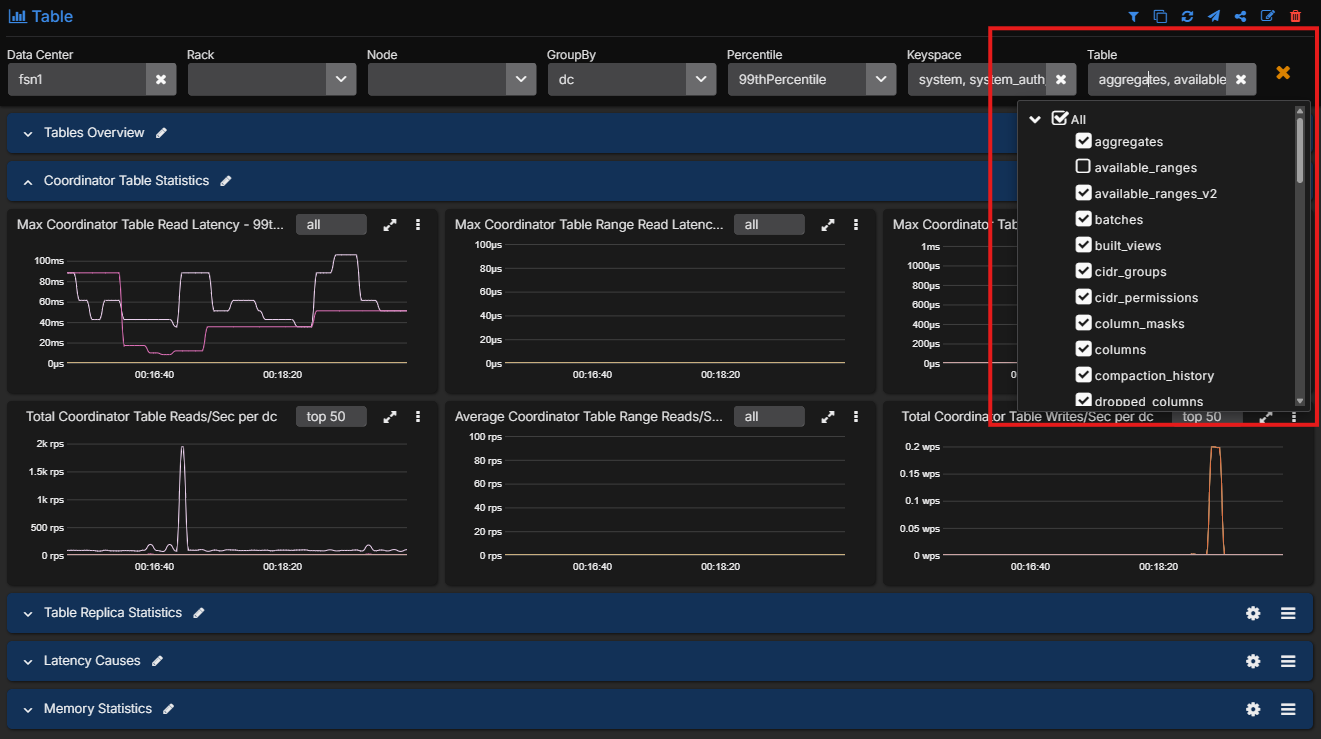
4. Table-level metrics
This is the point where Cassandra monitoring becomes genuinely diagnostic rather than descriptive. Cassandra itself exposes a rich table-level metric surface, and AxonOps captures it ready to use.
The table-level metrics worth capturing include:
| Metric family | What it tells you |
|---|---|
| Coordinator read, range read, and write latency per table | Which exact tables are contributing to tail latency on the coordinator path. |
| Coordinator read, range read, and write throughput per table | Which tables are carrying the traffic that lines up with the incident. |
| Replica read, range read, and write latency per table | Whether the slowdown is happening on the replica side rather than only at the coordinator. |
| Replica read, range read, and write throughput per table | Which tables are doing the most replica-side work under load. |
| Estimated partition count | Whether table growth and partition count are becoming operationally significant. |
| Max partition size | Whether a few very large partitions are likely driving expensive reads. |
| Mean partition size | Whether the table is broadly trending toward larger partitions, not just isolated outliers. |
| Tombstones scanned per query across percentiles | Whether reads are doing excess tombstone work, especially in the tail. |
| Live SSTable count | Whether compaction has left the table with too many active SSTables. |
| SSTables read per query across percentiles | Whether a single logical read is touching too many SSTables and increasing read amplification. |
| Bloom filter disk size | How much on-disk space the bloom filters for the table are consuming. |
| Bloom filter false positive ratio | Whether bloom filters are becoming less effective and sending reads to disk unnecessarily. |
| Speculative retries | Whether Cassandra is starting extra read work because responses are arriving too slowly. |
Without this layer, teams often know that the cluster is slow but cannot tell which table is actually responsible.
5. Threadpool metrics
Threadpools tell you whether work is queuing inside Cassandra before it is fully visible in application response time.
For each important threadpool, you want:
| Metric | What it tells you |
|---|---|
| Active tasks | How much work the pool is executing right now. |
| Pending tasks | Whether requests are arriving faster than the pool can process them. |
| Completed tasks | Useful for understanding whether throughput changed across the incident window. |
| Currently blocked tasks | Whether the pool is waiting on a resource or internal dependency right now. |
| All-time blocked tasks | Whether blocked work is a recurring pattern rather than a one-off event. |
The most useful pools to keep an eye on include ReadStage, MutationStage, RequestResponseStage, CompactionExecutor, MemtableFlushWriter, Repair_Task, Native_Transport_Requests, and GossipStage. In practice, AxonOps captures this class of metrics across Cassandra threadpools so you can see whether the queue is building in reads, writes, flush, compaction, repair, or request handling.
Where These Metrics Live In Cassandra
If you are building or auditing a Cassandra monitoring stack, it helps to know which of these signals come from the operating system and which come from Cassandra’s own JMX metrics.
System and OS metrics such as CPU, I/O wait, disk throughput, filesystem pressure, and network throughput do not come from Cassandra JMX. Those need to be collected from the node itself through your host collector.
Cassandra request, table, and threadpool metrics do come from Cassandra’s metrics subsystem and are exposed through JMX. The official Cassandra metrics documentation is the reference point here.
Request-level coordinator metrics
At the request-type level, Cassandra exposes client request metrics through ClientRequest MBeans. These are useful for establishing whether reads, writes, or range scans are slowing down before you isolate the problem to a specific table.
Common examples are:
org.apache.cassandra.metrics:type=ClientRequest,scope=Read,name=Latency
org.apache.cassandra.metrics:type=ClientRequest,scope=RangeSlice,name=Latency
org.apache.cassandra.metrics:type=ClientRequest,scope=Write,name=Latency
org.apache.cassandra.metrics:type=ClientRequest,scope=Read,name=Timeouts
org.apache.cassandra.metrics:type=ClientRequest,scope=Write,name=Failures
These MBeans are useful at the cluster and node level. They tell you which request class is in trouble, but they do not tell you which table is causing it.
Table-level metrics
The table-level MBean pattern is:
org.apache.cassandra.metrics:type=Table,keyspace=<Keyspace>,scope=<Table>,name=<MetricName>Representative examples for latency diagnosis are:
org.apache.cassandra.metrics:type=Table,keyspace=orders,scope=events,name=CoordinatorReadLatency
org.apache.cassandra.metrics:type=Table,keyspace=orders,scope=events,name=CoordinatorScanLatency
org.apache.cassandra.metrics:type=Table,keyspace=orders,scope=events,name=CoordinatorWriteLatency
org.apache.cassandra.metrics:type=Table,keyspace=orders,scope=events,name=ReadLatency
org.apache.cassandra.metrics:type=Table,keyspace=orders,scope=events,name=RangeLatency
org.apache.cassandra.metrics:type=Table,keyspace=orders,scope=events,name=WriteLatency
org.apache.cassandra.metrics:type=Table,keyspace=orders,scope=events,name=EstimatedPartitionCount
org.apache.cassandra.metrics:type=Table,keyspace=orders,scope=events,name=MaxPartitionSize
org.apache.cassandra.metrics:type=Table,keyspace=orders,scope=events,name=MeanPartitionSize
org.apache.cassandra.metrics:type=Table,keyspace=orders,scope=events,name=TombstoneScannedHistogram
org.apache.cassandra.metrics:type=Table,keyspace=orders,scope=events,name=SSTablesPerReadHistogram
org.apache.cassandra.metrics:type=Table,keyspace=orders,scope=events,name=LiveSSTableCount
org.apache.cassandra.metrics:type=Table,keyspace=orders,scope=events,name=BloomFilterFalseRatio
org.apache.cassandra.metrics:type=Table,keyspace=orders,scope=events,name=BloomFilterDiskSpaceUsed
org.apache.cassandra.metrics:type=Table,keyspace=orders,scope=events,name=SpeculativeRetries
This is the part of the metric surface that usually decides whether you can identify the root cause or only describe the symptom.
Threadpool metrics
The threadpool MBean pattern is:
org.apache.cassandra.metrics:type=ThreadPools,path=<Path>,scope=<ThreadPoolName>,name=<MetricName>Representative examples are:
org.apache.cassandra.metrics:type=ThreadPools,path=request,scope=ReadStage,name=PendingTasks
org.apache.cassandra.metrics:type=ThreadPools,path=request,scope=ReadStage,name=ActiveTasks
org.apache.cassandra.metrics:type=ThreadPools,path=request,scope=RequestResponseStage,name=PendingTasks
org.apache.cassandra.metrics:type=ThreadPools,path=request,scope=MutationStage,name=PendingTasks
org.apache.cassandra.metrics:type=ThreadPools,path=internal,scope=CompactionExecutor,name=PendingTasks
org.apache.cassandra.metrics:type=ThreadPools,path=internal,scope=CompactionExecutor,name=CompletedTasks
org.apache.cassandra.metrics:type=ThreadPools,path=internal,scope=MemtableFlushWriter,name=PendingTasks
org.apache.cassandra.metrics:type=ThreadPools,path=internal,scope=GossipStage,name=PendingTasks
The common metric names here are:
ActiveTasksPendingTasksCompletedTasksCurrentlyBlockedTaskTotalBlockedTasks
The path category depends on the pool. In Cassandra’s own metrics reference, ReadStage, MutationStage, and RequestResponseStage are under the request path, while pools such as CompactionExecutor, MemtableFlushWriter, and GossipStage sit under internal.
Percentiles and histograms
One important detail is that a large share of the useful Cassandra metrics are not simple counters. CoordinatorReadLatency is a Timer. ReadLatency is a Latency metric. TombstoneScannedHistogram and SSTablesPerReadHistogram are histograms.
That means the useful monitoring output is not just the MBean itself. It is the percentile view derived from it:
| Percentile or view | Why it tells you |
|---|---|
| p50 | Shows the typical request path seen by most traffic. |
| p75 | Useful for spotting moderate drift before the higher tail separates. |
| p90 | Often the point where read-path stress becomes operationally obvious. |
| p99 | Usually the first percentile where user-facing latency pain is unmistakable. |
| p999 | Exposes extreme tail behavior that averages and lower percentiles will hide. |
| Maximum | Shows the most severe outlier observed in the collection window. |
This is one reason Cassandra monitoring gets difficult with generic JMX scraping. The MBeans exist, but turning them into a high-resolution, percentile-heavy operational surface across many tables and threadpools is exactly where collection overhead and dashboard complexity start to climb.
Consistency-level views
Cassandra’s standard metrics documentation gives you the request-level and table-level MBeans, but consistency-level breakdowns are not exposed as one neat, single MBean family in the same way. In practice, a consistency-aware monitoring view is an analytical layer built on top of Cassandra’s request metrics and request context. That is why consistency-level visibility is rare in generic monitoring stacks and much more useful when it is already modeled for operators.
Why Node Averages Miss Cassandra Problems
A Cassandra incident often lives in one of the tails. Average CPU can look acceptable. Average read latency can look acceptable. Average disk throughput can look acceptable. Meanwhile, one read path at one consistency level against one table is getting materially worse.
That is why Cassandra monitoring needs:
- high enough collection resolution to preserve short-lived changes
- percentile visibility instead of averages alone
- coordinator metrics by consistency level
- table-level visibility
- threadpool visibility
When that depth is missing, engineers end up operating from broad symptoms instead of evidence. They know there is a latency problem, but they do not know whether it is a JVM issue, a queueing issue, or a data model issue.
A Real Monitoring Workflow For Cassandra High Latency
Consider a familiar production case. An application team reports that read latency has climbed sharply over the last twenty minutes. The cluster is still serving traffic. No node is down. The problem is visible in p99, not in the median.
That is the sort of incident where a proper monitoring workflow pays for itself.
Step 1: Start with system and JVM signals
Before diving into Cassandra-specific metrics, confirm whether the node or JVM is obviously under stress.
Look at:
- CPU
- I/O wait
- disk throughput
- heap usage
- GC pause time
If CPU is pinned, I/O wait is elevated, and disk throughput is near the practical ceiling of the node, the incident may be infrastructure-driven. If GC pauses have jumped and heap occupancy is climbing, you may be looking at JVM pressure rather than a storage-path issue.
If those metrics look stable, that is already useful. It tells you not to waste the next thirty minutes chasing generic host saturation.
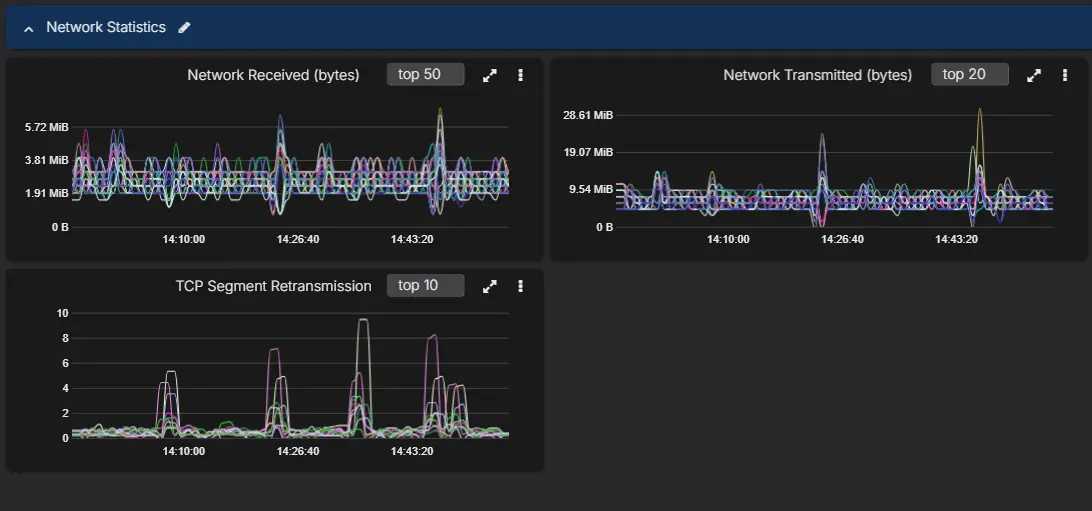
At this stage it is also worth checking whether the node-level network view is showing abnormal retransmissions. Cassandra read latency can look like a storage or coordinator problem when the real issue is packet loss or unstable network quality between nodes.
Step 2: Look at the coordinator path, not only cluster-wide latency
The next question is whether the incident is broad or narrow.
Use coordinator metrics to answer:
- Is this reads, writes, or range reads?
- Is the issue in p99 and p999 only, or across the whole distribution?
- Is one consistency level affected more than the others?
This is where filtering by percentile and consistency level becomes operationally useful.
Imagine the picture looks like this:
- p50 is steady
- p90 is slightly elevated
- p99 and p999 read latency are sharply worse
LOCAL_QUORUMreads are affected more thanONE
That pattern already tells you something important. The cluster is not uniformly slow. A subset of read traffic is struggling, and the problem is more visible when the coordinator has to wait for multiple replicas.
Step 3: Check threadpools for queueing
Now move to the Cassandra internals that sit between host health and table behavior.
If ReadStage pending tasks are rising, or if request-handling pools are building a queue, the coordinator latency increase is no longer abstract. You can see work backing up.
Useful interpretations here are:
- rising
ReadStagepending tasks: the read path is getting slower than the request rate - blocked or rising
CompactionExecutor: compaction pressure may be contributing to read amplification - elevated
MutationStagepending tasks during a read complaint: the real issue may be mixed workload pressure rather than reads alone
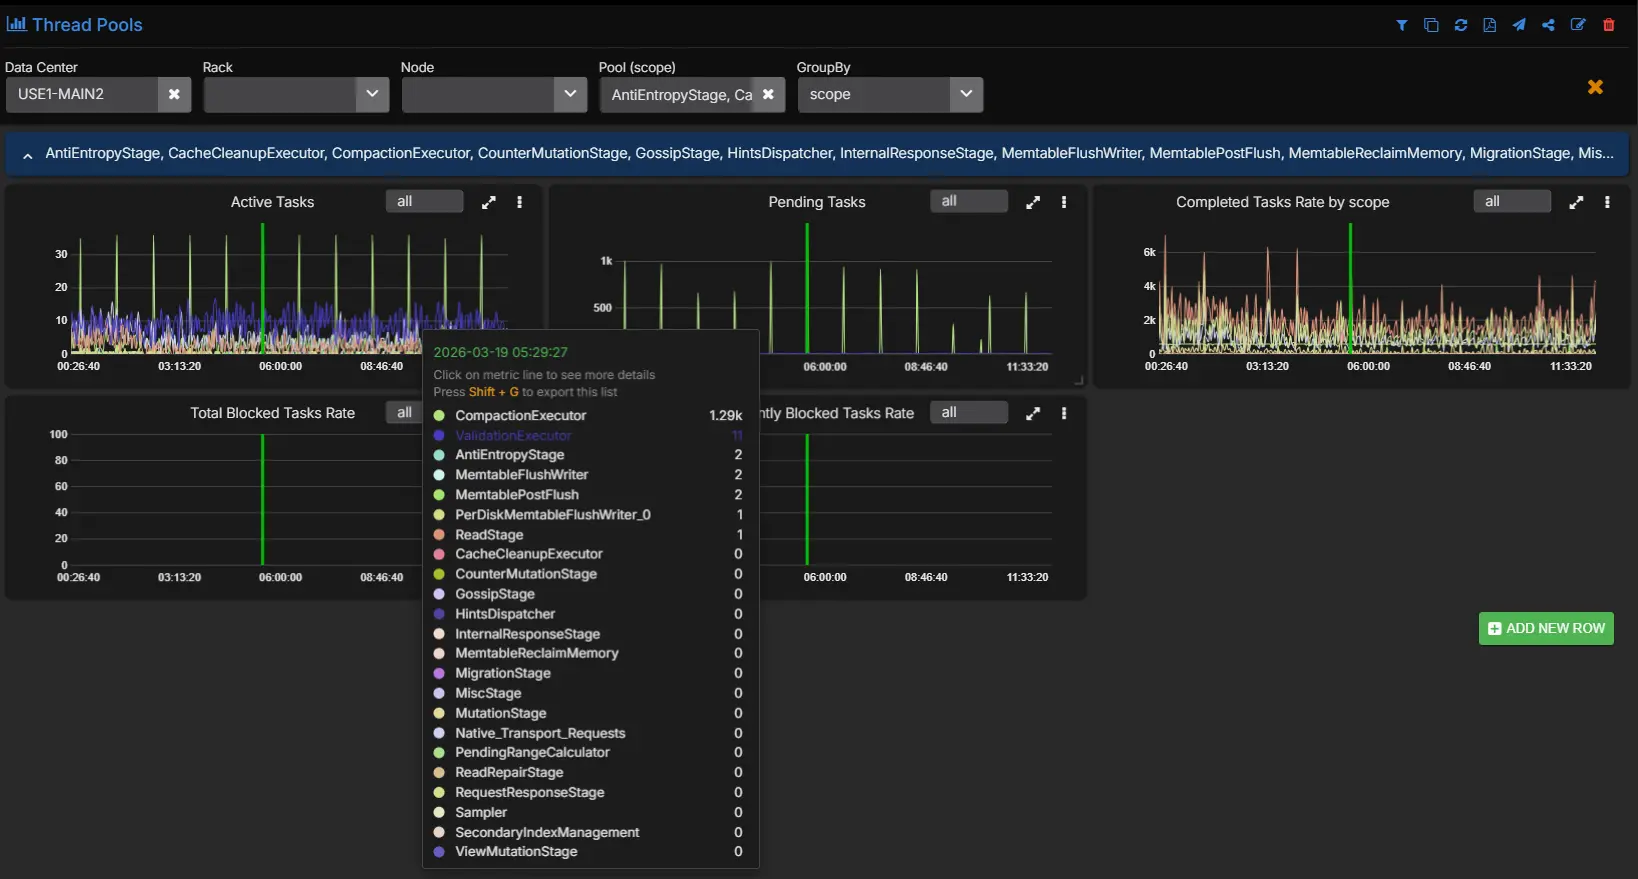
Threadpool metrics do not give you the final answer, but they do tell you where the queue is forming.
Step 4: Isolate the exact tables involved
Once you know this is a read-path problem and not a broad host failure, the next question is which tables are responsible.
Cluster averages are a bad tool for this. Keyspace averages are often not much better. You need to filter to table level.
Suppose the table-level view shows that nearly all of the elevated p99 coordinator read latency is concentrated in one table. At that point, the incident changes shape. You are no longer asking why Cassandra is slow. You are asking why reads against that specific table are expensive.
Step 5: Use the table metrics to identify the real cause
This is where the table-level metrics become diagnostic.
Look at the affected table and compare:
- tombstones scanned per query
- SSTables read per query
- live SSTable count
- bloom filter false positive ratio
- speculative retries
- partition size metrics
A realistic example might look like this:
- tombstones scanned per query jumps sharply in p99
- SSTables read per query also rises
- live SSTable count is elevated
- bloom filter false positive ratio is not the main outlier
- speculative retries start to appear
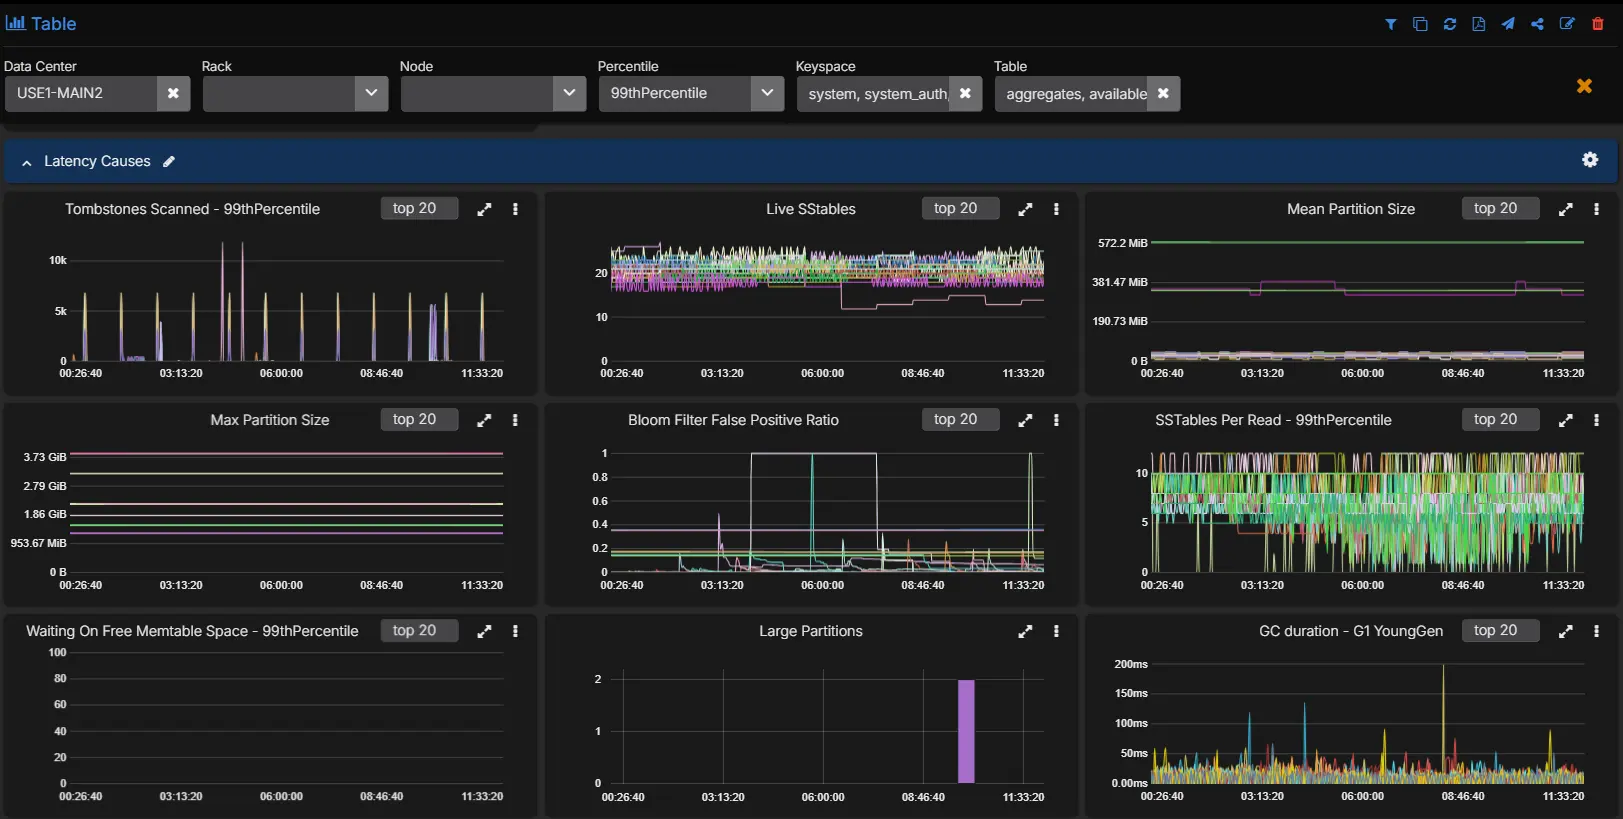
That combination usually points to a read path that is paying too much work per query. Tombstone-heavy partitions, too many SSTables per read, and a growing tail in coordinator latency fit together. The exact root cause may be a TTL-heavy workload, a delete-heavy access pattern, a table that needs compaction to catch up, or a query pattern that is forcing Cassandra to scan more on-disk state than the application expects.
That is a very different diagnosis from “the cluster is slow.”
Step 6: Confirm the diagnosis in logs and recent operational history
Once the metric pattern is clear, you can correlate with:
- logs
- recent compaction behavior
- repair activity
- backups
- configuration changes
- nodetool events
This is where integrated monitoring becomes useful. Engineers do not need to jump between half a dozen tools just to confirm whether the latency spike lines up with compaction pressure, a repair window, a backup event, or a configuration change on the nodes that own the affected replicas.
A Simple Latency Triage Flow
| Step | What to check | If it is abnormal | Likely direction |
|---|---|---|---|
| 1 | System resources: CPU, I/O wait, disk throughput, GC, memory | Node or JVM saturation is obvious | System resource pressure |
| 2 | Network quality: retransmissions, transmitted and received throughput, consistency-specific timeouts | Retries and timeouts line up with consistency-level latency | Network path issue |
| 3 | Request handling: threadpool pending tasks, blocked tasks, throughput changes | Queues build without obvious hardware saturation | Configuration or concurrency bottleneck |
| 4 | Table metrics: tombstones, SSTables per read, partition sizes, bloom filter ratio, speculative retries | Only some tables show heavy read-path cost | Data model or table design issue |
The practical flow is:
- Start with host and JVM metrics.
- Check whether the coordinator problem is broad or tied to a consistency path.
- Look for queue buildup in the threadpools.
- Move to exact tables.
- Use the table metrics to decide whether the issue is read amplification, tombstones, partition shape, or another data-model-related cause.
Configuration often sits between the host view and the table view because it tends to show up as queueing rather than as an immediate node failure. If a threadpool is backing up and the hardware still has headroom, it is worth checking whether the concurrency settings, request mix, and node shape are still aligned with the workload.
An Example Root Cause Analysis
A complete diagnosis from the workflow above might read like this:
The latency increase was not caused by node-wide CPU or GC pressure. The issue was isolated to tail read latency on LOCAL_QUORUM reads. ReadStage pending tasks increased at the same time. Table-level coordinator and replica metrics showed one table carrying most of the elevated latency. That table also showed a sharp rise in tombstones scanned per query and SSTables read per query, which indicates the read path was doing materially more work per request. The root cause was a tombstone-heavy read pattern on a specific table rather than a general cluster failure.
That is what good Cassandra monitoring should give you: not just evidence that latency is high, but enough visibility to identify exactly why.
The Metrics And Context Required
The educational point here is straightforward. Cassandra high-latency diagnosis usually needs all of these layers together:
- system and OS metrics
- JVM metrics
- coordinator metrics by percentile and consistency level
- threadpool health
- table-level latency and throughput
- storage-path indicators such as SSTables per read and bloom filter behavior
- tombstone visibility
- logs and operational history
This is the monitoring surface AxonOps captures at 5-second resolution and presents as one workflow. Cassandra exposes the underlying metrics. The operational question is whether your monitoring stack captures enough of them, at useful enough resolution, and with low enough overhead that engineers can rely on them during real incidents.
For a broader comparison of monitoring approaches, see Cassandra Monitoring Tools Comparison 2026. For a closer look at collection overhead, see Monitoring Cassandra: The Cost of Collecting Metrics.
Conclusions
If your goal is to monitor Cassandra well, start by assuming that node health alone will not explain your hardest incidents. Capture the host and JVM metrics, but do not stop there. Add coordinator metrics by percentile and consistency level, threadpool metrics, and table-level metrics that expose tombstones, SSTables per read, bloom filter behavior, partition size, and speculative retries.
That is the level of detail required to move from “latency is high” to “this exact table and read path are causing the problem.” Without it, engineers end up guessing. With it, they can identify the root cause and fix the right thing.
If you want to see that monitoring workflow in practice, the AxonOps Cassandra monitoring page shows the product surface behind these examples. If you want to discuss your current Cassandra monitoring coverage, contact us.
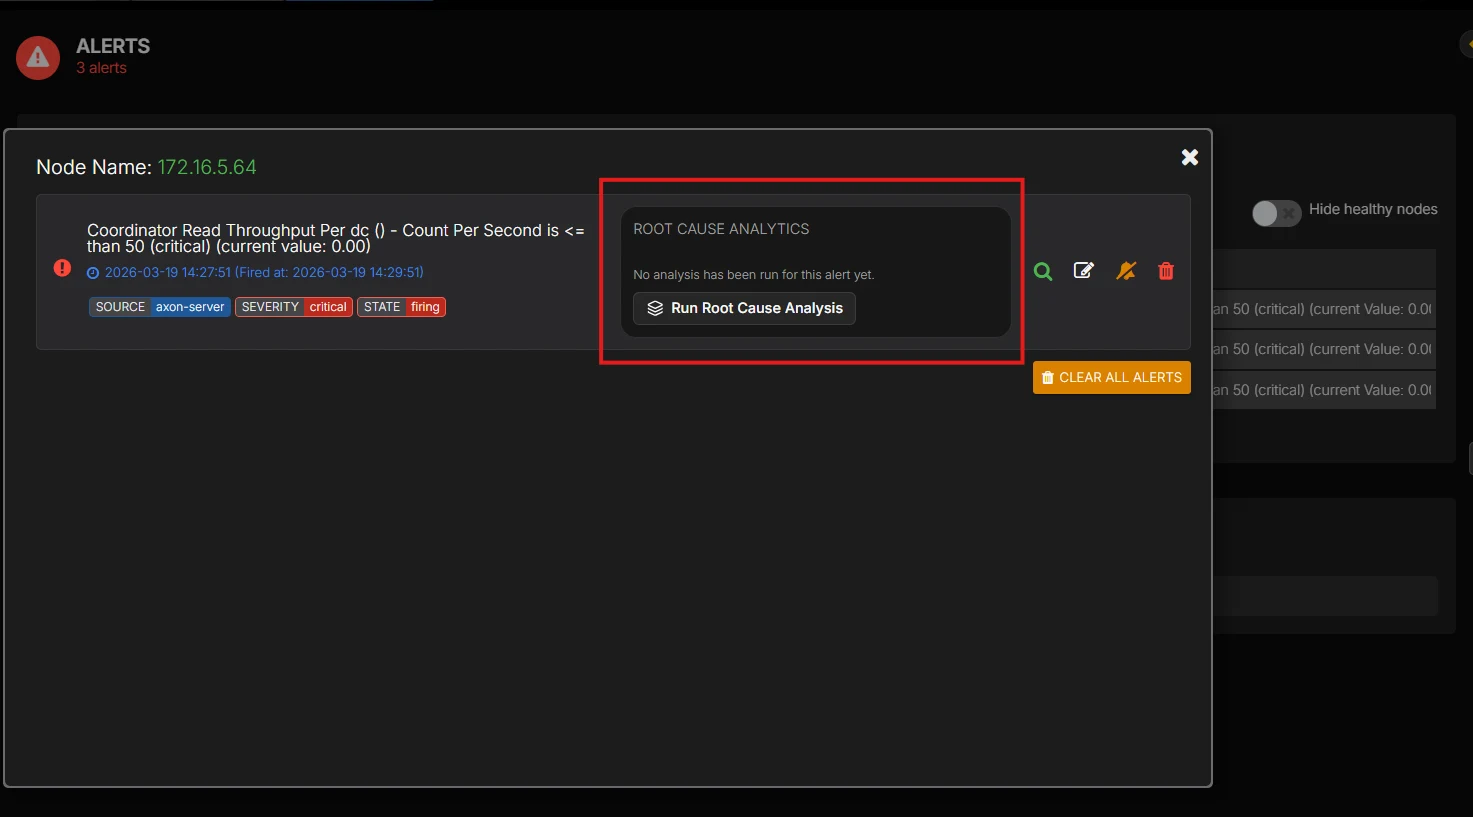
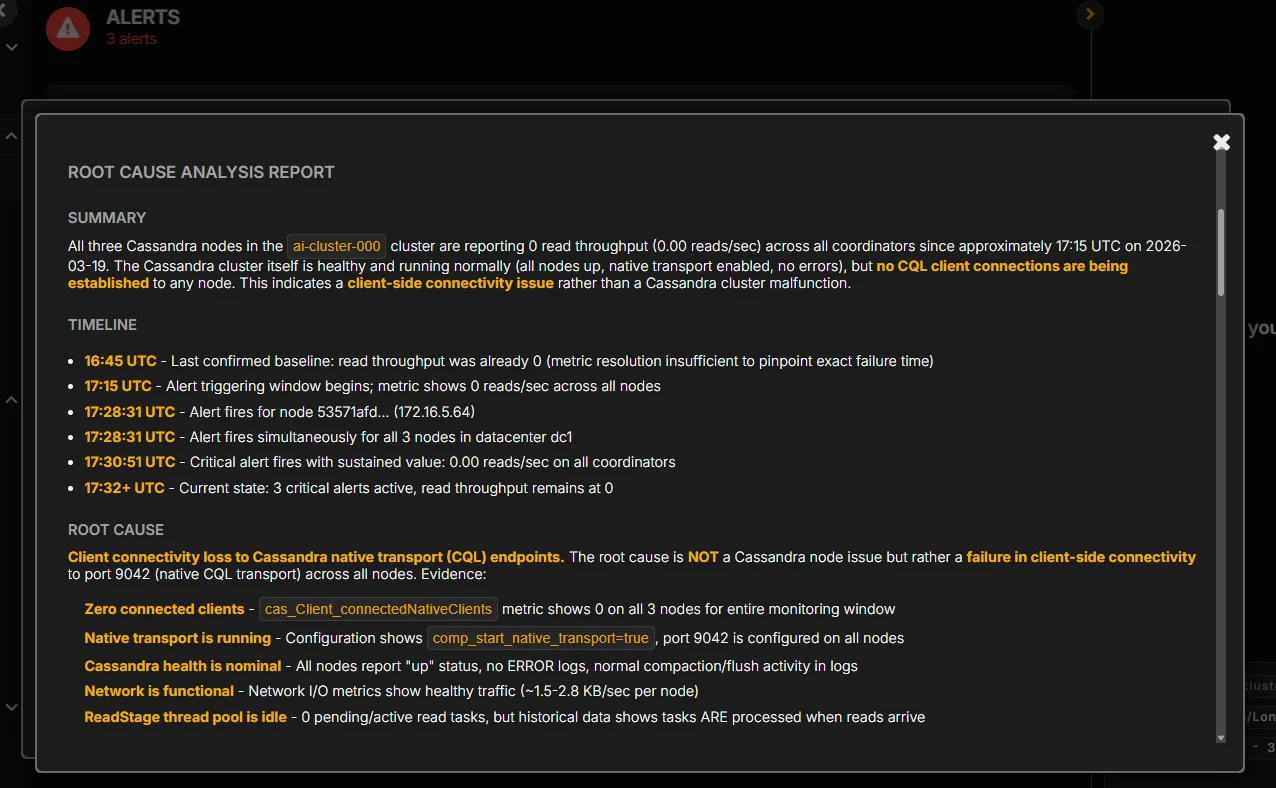
If you want AI-assisted root cause analysis to surface that diagnosis automatically instead of piecing it together by hand during an incident, talk to us.